Number of cities and municipalities covered
Our database currently includes most cities with more than 10,000 inhabitants and many smaller towns in Germany, Austria, Switzerland, Liechtenstein, Luxembourg, Belgium, the Netherlands, France, Great Britain, Ireland, Denmark, Sweden, Norway, Finland, Italy, Spain, Portugal, Poland, the Czech Republic, Slovakia, Slovenia, Hungary, Romania, Bulgaria, Serbia, Croatia, Turkey and Greece. This means that water values are currently available for around 500 million people in these countries.
The data is regularly updated and expanded, you can follow the development on the map, or you can enter a city name in the search query below as a test.
Austria
Belgium
Bulgaria
Croatia
Czech
Denmark
Finland
France
Germany
Greece
Hungary
Ireland
Italy
Liechtenstein
Luxembourg
Netherlands
Norway
Poland
Portugal
Romania
Serbia
Slovakia
Slovenia
Spain
Sweden
Switzerland
Turkey
USA
United Kingdom
Coverage of our data in relation to the population
We check the information provided by the municipalities and waterworks at regular intervals and update our values if we find more recent data. We also regularly add further municipalities and parameters to the database. You can check the current status of the recorded data at any time on this page.
If you want to know whether your city is included in our database, simply enter your postcode or the city name in the search field:
If your city is included, you can also see when the data was last updated by us. On our map you can view the hardness range for each water supply zone or town covered, as well as the nitrate load.
These nitrate values differ significantly from the values measured in the groundwater that have been in the news recently. The difference can be explained by the fact that the points at which the groundwater is tested are more or less far away from the wells from which the drinking water is obtained.
It therefore takes months to years for the water to reach the wells. The water suppliers then have to react, for example if the nitrate levels in the well water are too high, and resort to sometimes expensive treatment methods. You can check the result at any time on our map.
Even if the overall situation shows a slight improvement, the distribution of nitrate concentrations within Germany is still a cause for concern. You can find our analyses on the study page.
Further information on the groundwater situation can be found here.
Legal situation using the example of the DACH countries
According to § 14 of the German Drinking Water Ordinance (§ 5 of the Austrian Drinking Water Ordinance and Art. 3 of the Swiss TBDV), water supply companies are obliged to have microbiological and chemical tests carried out on the drinking water by an accredited laboratory on a regular basis - but at least once a year. The analyses are forwarded to the relevant health authority. According to § 21 of the German Drinking Water Ordinance (§ 6 of the Austrian Drinking Water Ordinance and Art. 5 of the Swiss TBDV), consumers must be provided with suitable and up-to-date information material on the quality of the drinking water provided in writing or by means of a notice at least once a year.
Most cities and municipalities also adhere to this and the data we have recorded in our database is based on this.
In Germany, there is no central, nationwide organisation that collects and provides drinking water analyses. In Austria, there is a voluntary drinking water database, but it is incomplete and contains some outdated data.
In Austria, nitrate is explicitly mentioned as a parameter about which information must be provided, but not in Germany.
Procedure
The biggest challenge in presenting the individual water qualities are the individual water supply areas, which rarely adhere to the boundaries of the postcode zones. Therefore, a query based solely on postcodes is far too imprecise and often misleading.
Particularly in rural areas, but also in many large cities (for example in Dresden, Frankfurt/Main, Hamburg, Leipzig or Wiesbaden), water is fed in from different catchment areas and has very different water values depending on the district.
Wherever the analysis data of the cities and municipalities make it necessary, we have created our own area boundaries, independent of postcode, in order to be able to provide you with street-specific results of water hardness and nitrate values.
Problems with allocationg
The situation is even more challenging in some districts, such as Frankfurt/Main. Here, depending on demand, sometimes very hard and sometimes very soft water is fed in. The origin of the water can change daily and is not updated daily in the publicly available documents.
In this case, we explicitly point this out in the apps. If you live in one of these areas, you should contact the utility company directly via the link to their website and enquire about the daily updated water values.
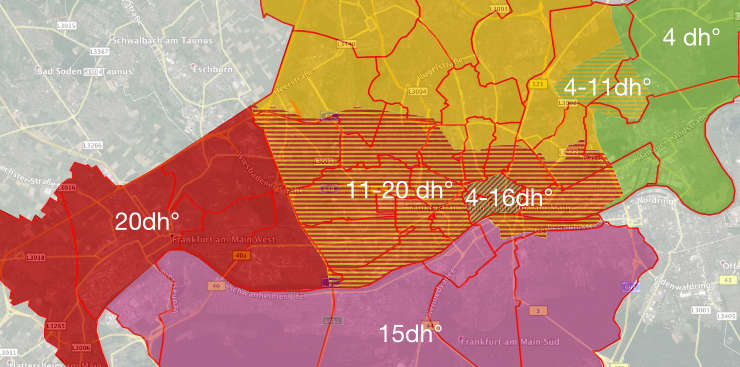
Water supply zones and postcodes in Frankfurt/Main